What are current sea level rise forecasts for California?
Sign up for Baykeeper's newsletter
California's official seal level rise projections were updated in 2018, based on the best available science. The most likely projection predicts ~3 feet in elevated sea levels in San Francisco by the year 2100—which would wreak havoc on low-lying areas.
California’s official sea level rise guidance and associated projections have been updated since the 2012 release of a report by the National Academy of Sciences—which remains an excellent resource for understanding the processes responsible for sea level rise and the reasons why estimating its magnitude is so difficult. The Ocean Protection Council’s 2017 science update provides information on new science developments, leading to the 2018 release of revised Sea Level Rise Guidance.
Projections from the Ocean Protection Council's 2018 Guidance are provided below for San Francisco. Roughly equal rates of sea level rise are estimated along all major urban centers of Central and Southern California. By 2100, the most likely—66% probability—level of sea level rise is approximately 3 feet, or 1 meter, which could wreak havoc on many low-lying urban centers and permanently inundate many of California’s remaining coastal wetlands.
California is advising communities to utilize various projections based on anticipated development lifetimes and sensitivity to flooding. The "Low" projection listed below is designated as the 'low risk aversion' projection, equivalent to the upper range of the most likely estimates—66% probability of occurrence. The "Medium" projection is listed in the guidance as a 'medium to high level of risk aversion'—with 0.5% probability of occurring. And the "Extreme" level is based on NOAA projections identified in Sweet et al, 2017.
| 2000 - 2050 Projections | 2000 - 2080 Projections | 2000 - 2100 Projections | |||||||
|---|---|---|---|---|---|---|---|---|---|
| EmissionScenario | Low | MediumHigh | Extreme | Low | MediumHigh | Extreme | Low | MediumHigh | Extreme |
| Low | — | — | — | 1.8 | 3.9 | — | 2.4 | 5.7 | — |
| High | 1.1 | 1.9 | 2.7 | 2.4 | 4.5 | 6.6 | 3.4 | 6.9 | 10.2 |
Due to various geophysical processes, sea level rise will vary along the coast, with lower rates north of Cape Mendocino (~20 miles south of Eureka), due to tectonic processes, resulting in uplifting of the land, thus counteracting some of the effects of rising sea levels.
Sea levels along the West Coast are characterized by dramatic year to year swings, making long-term trends highly uncertain at this point. Oceanic conditions govern the stagnation or sudden increase in sea level rise along the West Coast and warming waters could set off a rapid increase in the trend. These phenomenon are discussed in more detail below.
How does the pace of sea level rise in California compare to other parts of the country?
Logic would suggest that, since the earth is warming virtually everywhere, the ocean is large, and the melting of ice caps would ‘rise all tides’, we could expect uniform increases in sea levels around the world. But this isn’t the case. Natural and human-driven changes will yield dramatic variations in relative sea level rise - a phenomenon expected to become more dramatic over coming decades.
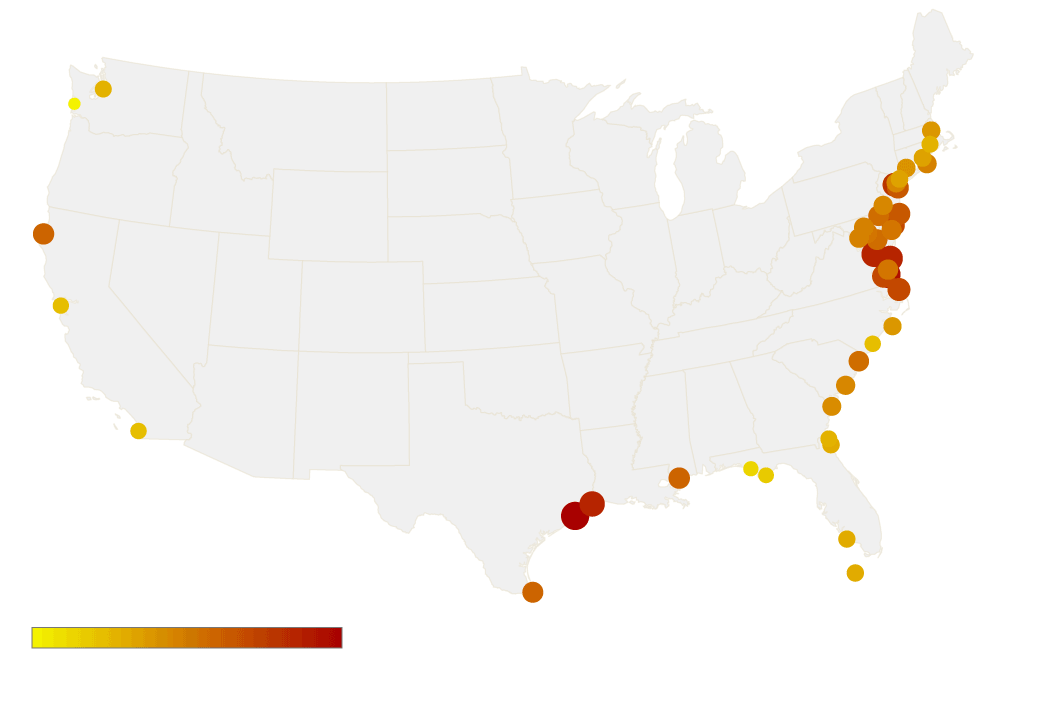
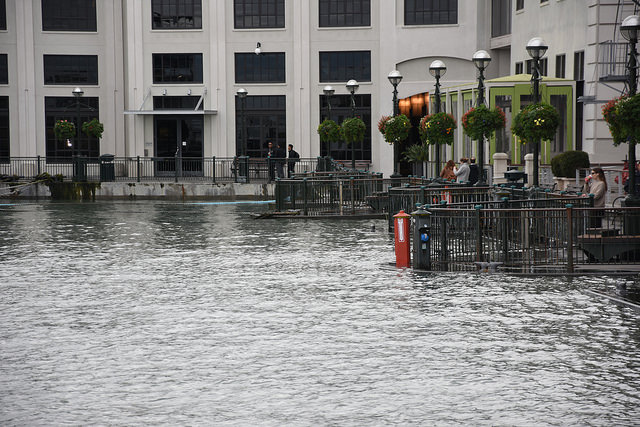
Regional factors that influence the accelerating or decelerating pace of sea level rise have been recently examined by scientists at the National Oceanic and Atmospheric Administration (NOAA) throughout the United States. They found that those areas with the greatest increases in mean sea level are located along the Mid-Atlantic and in the Chesapeake Bay, the coasts of North and South Carolina, southern Texas and Louisiana. These areas also coincide with higher frequency of minor location-specific flooding—so-called “nuisance” flooding--which is an indicator of community-specific impacts. Examples of nuisance flooding in the Bay Area would be those the type of impacts observed during so-called King Tides. Increased incidence of minor flooding today signals the likelihood that such places will be permanently submerged in the future.
NOAA’s recent report did not judge the most likely sea level rise in California or elsewhere, but judged how various regions would fare if the sea levels rose around the world, on average, according to six different scenarios, ranging from 0.3 meters in height (Low) to 2.5 meters (Extreme). Key findings from NOAA’s recent analysis include:
- Along regions of the Northeast Atlantic (Virginia coast and northward) and the western Gulf of Mexico coasts, sea level rise is projected to be greater than the global average for almost all future sea level rise scenarios.
- Along much of the Pacific Northwest and Alaska coasts, seas are projected to rise less than the global average due to uplifting the land associated with tectonic movement.
- Along almost all U.S. coasts outside Alaska, seas will rise higher than the global average under the Intermediate-High (1.5 m), High (2.0 m) and Extreme (2.5 m) scenarios.
San Francisco and La Jolla have recorded an average sea level rise of about 2.0 mm per year since the late 19th century. This is comparable to a global average during the 20th century of 1.4 mm per year - a pace that has not been exceeded in any century since at least 2,800 years ago. Around the US, recent sea level rise trends are highest in Louisiana (8–10 mm/year), Texas (4–7 mm/year) and along the Northeast Atlantic from Virginia to New Jersey (3–5 mm/year). Similar variation has been found in other parts of the world, based on human impacts and natural processes.
2.2
2.8
Seattle
Boston
4.2
Atlantic City
2.0
San Francisco
2.0
La Jolla
6.6
Galveston
2.3
Naples
0.4
6.6
Regional variability in mean sea level rise - millimeters (mm) per year
NOAA’s estimates for San Francisco, based on the six scenarios of average sea level rise around the world, are shown in the chart below. This indicates that rising seas along San Francisco and much of California would roughly match the global average. For example, the average intermediate sea-level rise projection for 2100 is 1 meter, or 3.2 feet. Under this scenario, seas would rise around the Bay Area and most of California at about the same rate.
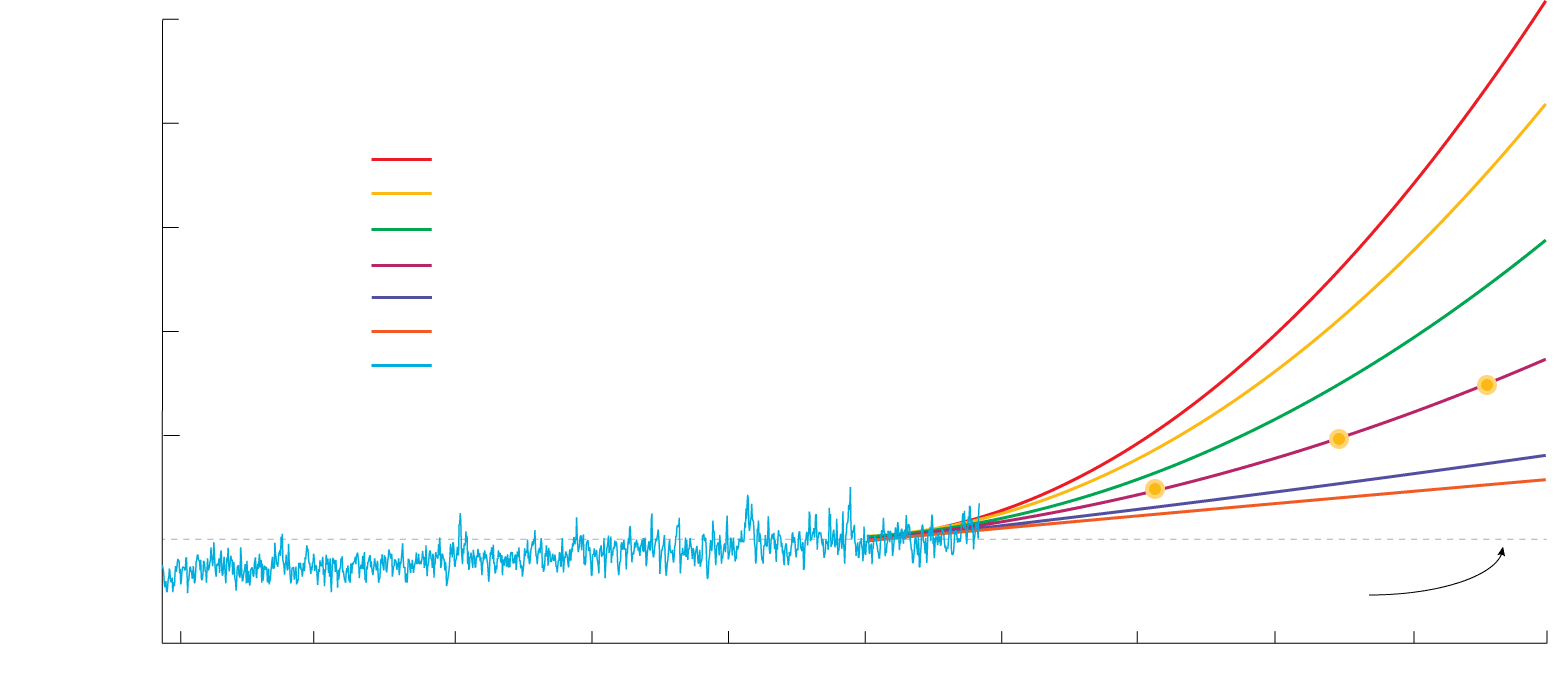
10
Sea Level Rise Scenarios for San Francisco
8
extreme (2.5 meters by 2100)
high (2 m)
6
intermediate-high (1.5 m)
intermediate (1 m)
Feet relative to
mean sea level
in 2000
intermediate- low (0.5 m)
+ 3 ft
above 2000
baseline
low (0.3 m)
4
monthly mean sea level (1897 to Feb 2017)
+ 2 ft
2
+ 1 ft
0
2000 baseline for sea level rise projections
-2
1900
1920
1940
1960
1980
2000
2020
2040
2060
2080
2100
Since sea level rise has nearly tripled in Galveston, TX, compared to San Francisco, the 2100 forecast is appreciably greater there. If average sea level increased globally by around 3.2 feet, in Galveston over 5 feet of sea level rise would be expected. This would likely induce deep ecological, economic and societal changes to this coastal community.
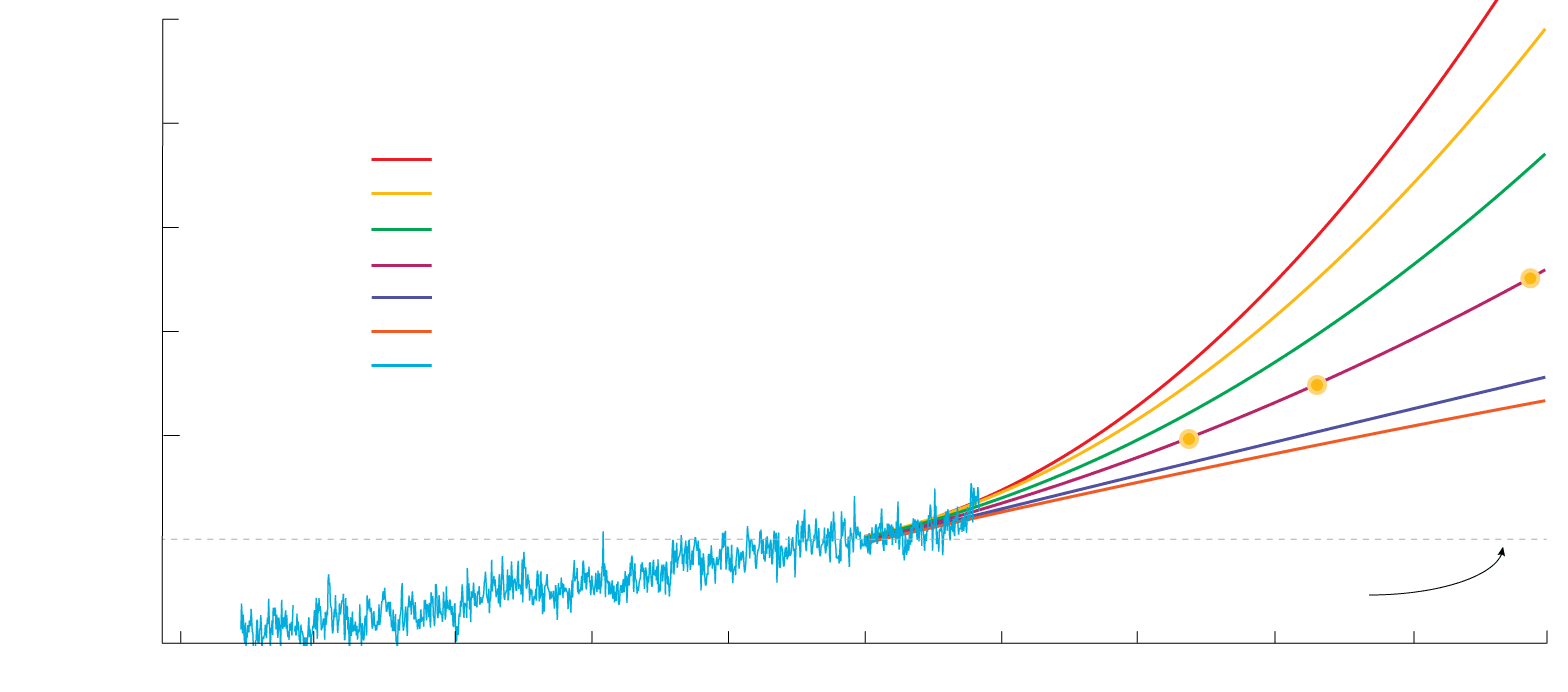
10
Sea Level Rise Scenarios for Galveston, TX
8
extreme (2.5 meters by 2100)
high (2 m)
6
intermediate-high (1.5 m)
intermediate (1 m)
Feet relative to
mean sea level
in 2000
intermediate- low (0.5 m)
+ 5 ft above
2000 baseline
low (0.3 m)
4
monthly mean sea level (1908 to Feb 2017)
+ 3 ft
2
+ 2 ft
0
2000 baseline for sea level rise projections
-2
1900
1920
1940
1960
1980
2000
2020
2040
2060
2080
2100
What factors influence regional sea levels?
Many factors influence the level of sea level rise for particular areas. Some factors are related to climate and carbon emissions (like ocean circulation), some are the result of specific human activities (like oil extraction), and some are natural geological processes (like land uplift).
When NOAA recently modeled regional variations in sea level rise, they considered climate and non-climate related factors specific to various regions around the US. Some of these factors make seas rise faster in particular areas, and others make the land sink lower (known as “land subsidence”). These include:
- Shifts in oceanographic factors such as circulation patterns (climate change related)
- Changes in the Earth’s gravitational field and rotation, and movement of the crust and upper mantle, due to melting of land-based ice (climate change related)
- The ongoing rising and falling of land once covered in ice-age glaciers—a phenomenon known as glacial isostatic adjustment (GIA) or 'post-glacial rebound'. (natural, non-climate related)
- Sediment compaction (natural, non-climate)
- Groundwater and fossil fuel withdrawals (human-induced)
On the local and regional scale, the highest rates of sea level rise are located in areas affected by human-induced factors, such as subsurface freshwater and oil withdrawal, including in Texas and Louisiana (approximately 5-10 mm/yr). Non-human related processes are contributing to subsidence in areas from Virginia to New Jersey, including sediment compaction and GIA. On the other hand, regions including southern Alaska have a lowering sea level trend, due to tectonic effects and GIA-related uplifting of the land. In effect, these lands are still expanding following the melting of glaciers from the last ice age and are being elevated as tectonic plates collide.
For a more technical review of the factors affecting regional variation in sea level rise review this recent NOAA publication. Review this report for an update on California-specific sea level rise science.
What is the role of El Niño in sea level rise?
The weather phenomenon known as El Niño gives us a preview of what conditions will be like in California all year round with rising seas. We can expect to see much more frequent flooding in low-lying areas, affecting housing, roads, and other essential infrastructure. El Niño years will heighten increasing flood levels well into the future.
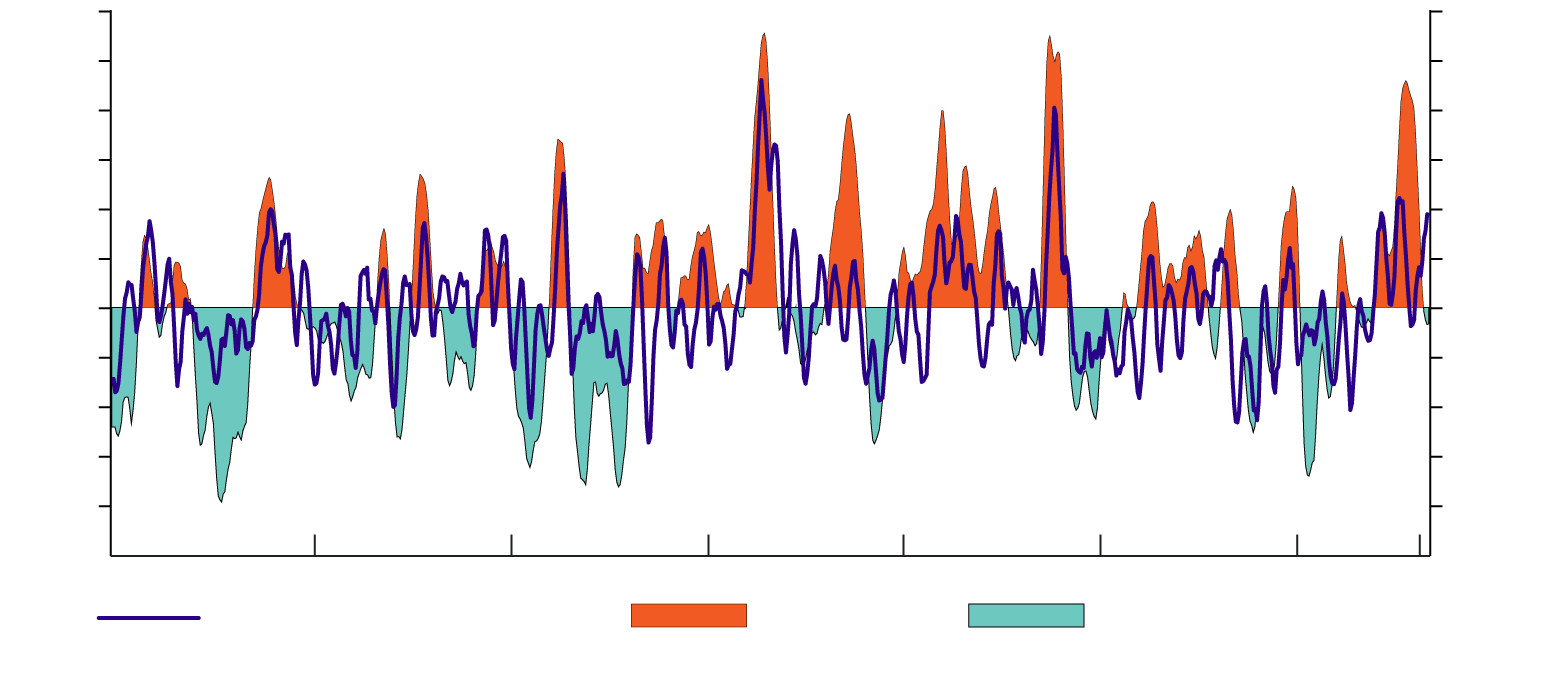
Californians are now accustomed to hearing about El Niño as an indicator of higher than average rainfall (a phenomenon that failed to materialize in 2015/16). But the same conditions believed to favor wet weather also result in higher sea levels. The figure below charts the ENSO index (an indicator of El Niño strength) against the 5-month moving average of the average monthly sea level in San Francisco from 1950 to 2017. Water level data has been adjusted for the trend in sea level rise in order to compare events over time.
Since 1950, the three El Niño events with the highest ENSO index were during the winters of 1982/83, 1997/98 and 2015/16. The former two events coincided with some of the highest average sea levels, as well as some of the wettest winters on record, while 2015/16 saw slightly higher than average sea levels in San Francisco, coinciding with slightly higher than average rainfalls.
3.0
0.3
0.2
2.0
0.1
1.0
Sea Level
Anomoly (m)
ENSO
index
-0.1
-1.0
-0.2
-2.0
1950
1960
1970
1980
1990
2000
2010
2017
negative ENSO (cool)
positive ENSO (warm)
monthly sea level (5-month moving average)
As a result of the medium duration (several months) rise in tidal elevation that occur during El Niño winters, we see more frequent ”clear sky” flooding, associated with the sorts of high tides that occur on a monthly basis. This means that the annual peaks in sea levels seen during so-called King Tides are even more pronounced in El Niño years and the intense storms sometimes associated with El Niño will raise seas to levels that flood critical infrastructure and homes at unpredictable times. The region saw this in 1998 during statewide flood events coinciding with El Niño driven warming and intense storms. In future years the impacts associated with such storms will increase significantly.
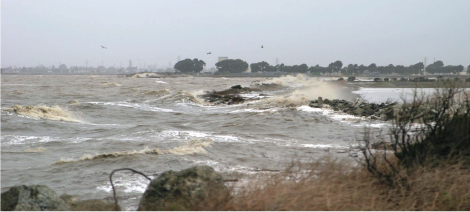
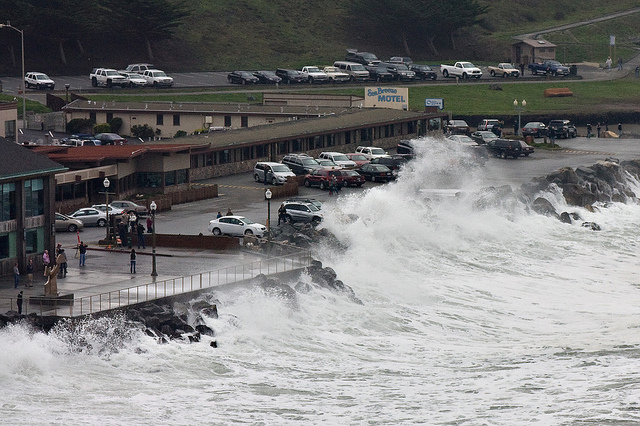
Header photo credits: Newark Slough King Tide survey photo from Nov 24, 2015 by Jennifer Heroux; South Imperial Beach, CA King Tide on Dec 13, 2012 by TRNERR
References
National Research Council. 2012. Sea-Level Rise for the Coasts of California, Oregon, and Washington: Past, Present, and Future. National Academy of Sciences.
Griggs el at (California Ocean Protection Council Science Advisory Team Working Group). 2017. Rising Seas in California: An Update On Sea-Level Rise Science. The California Ocean Protection Council.
Sweet et al. 2017. Global and Regional Sea Level Rise Scenarios for the United States. National Oceanic and Atmospheric Administration (NOAA) Technical Report NOS CO-OPS 083.
Sweet et al. 2014. Sea Level Rise and Nuisance Flood Frequency Changes around the United States. National Oceanic and Atmospheric Administration (NOAA) Technical Report NOS CO-OPS 073.